Gathering Intelligences · Experimental · Step 3
Making sense
What might be the most useful ways to interpret what you have assembled? Discuss it with others: a map, a diagram, or a chart? And what values are most evident in it?
See examples
Three ways to show a record. Each shows something different. Download the skill for the one that fits your question.
-
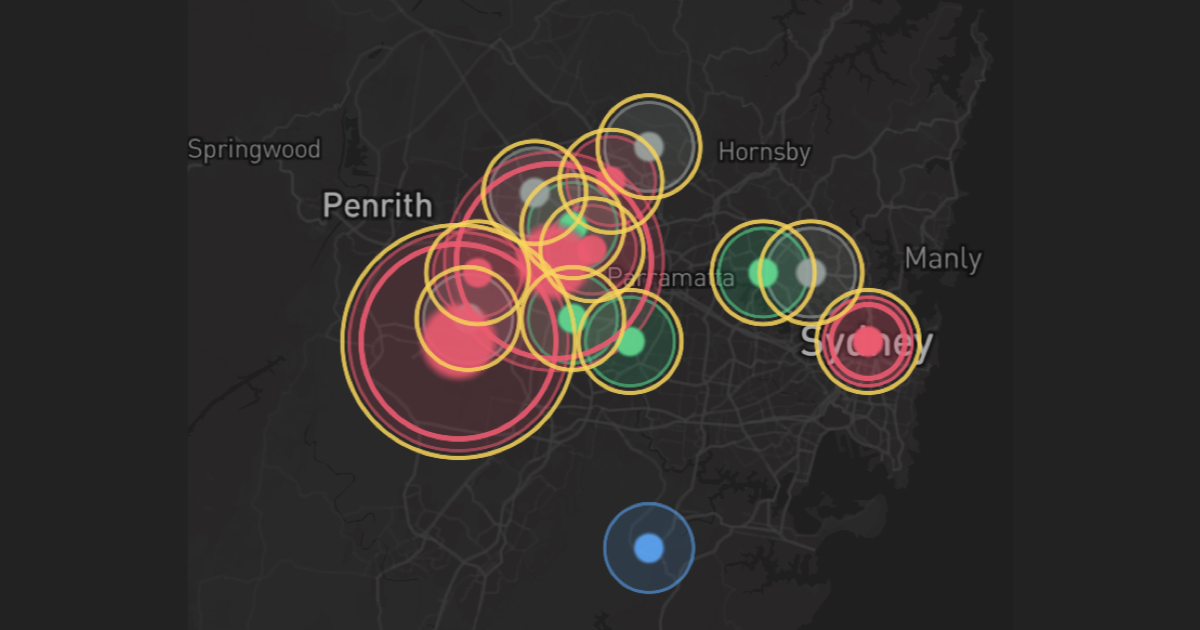
A map
Data Centres Transparency Project
Where things are, and how sites compare.
-
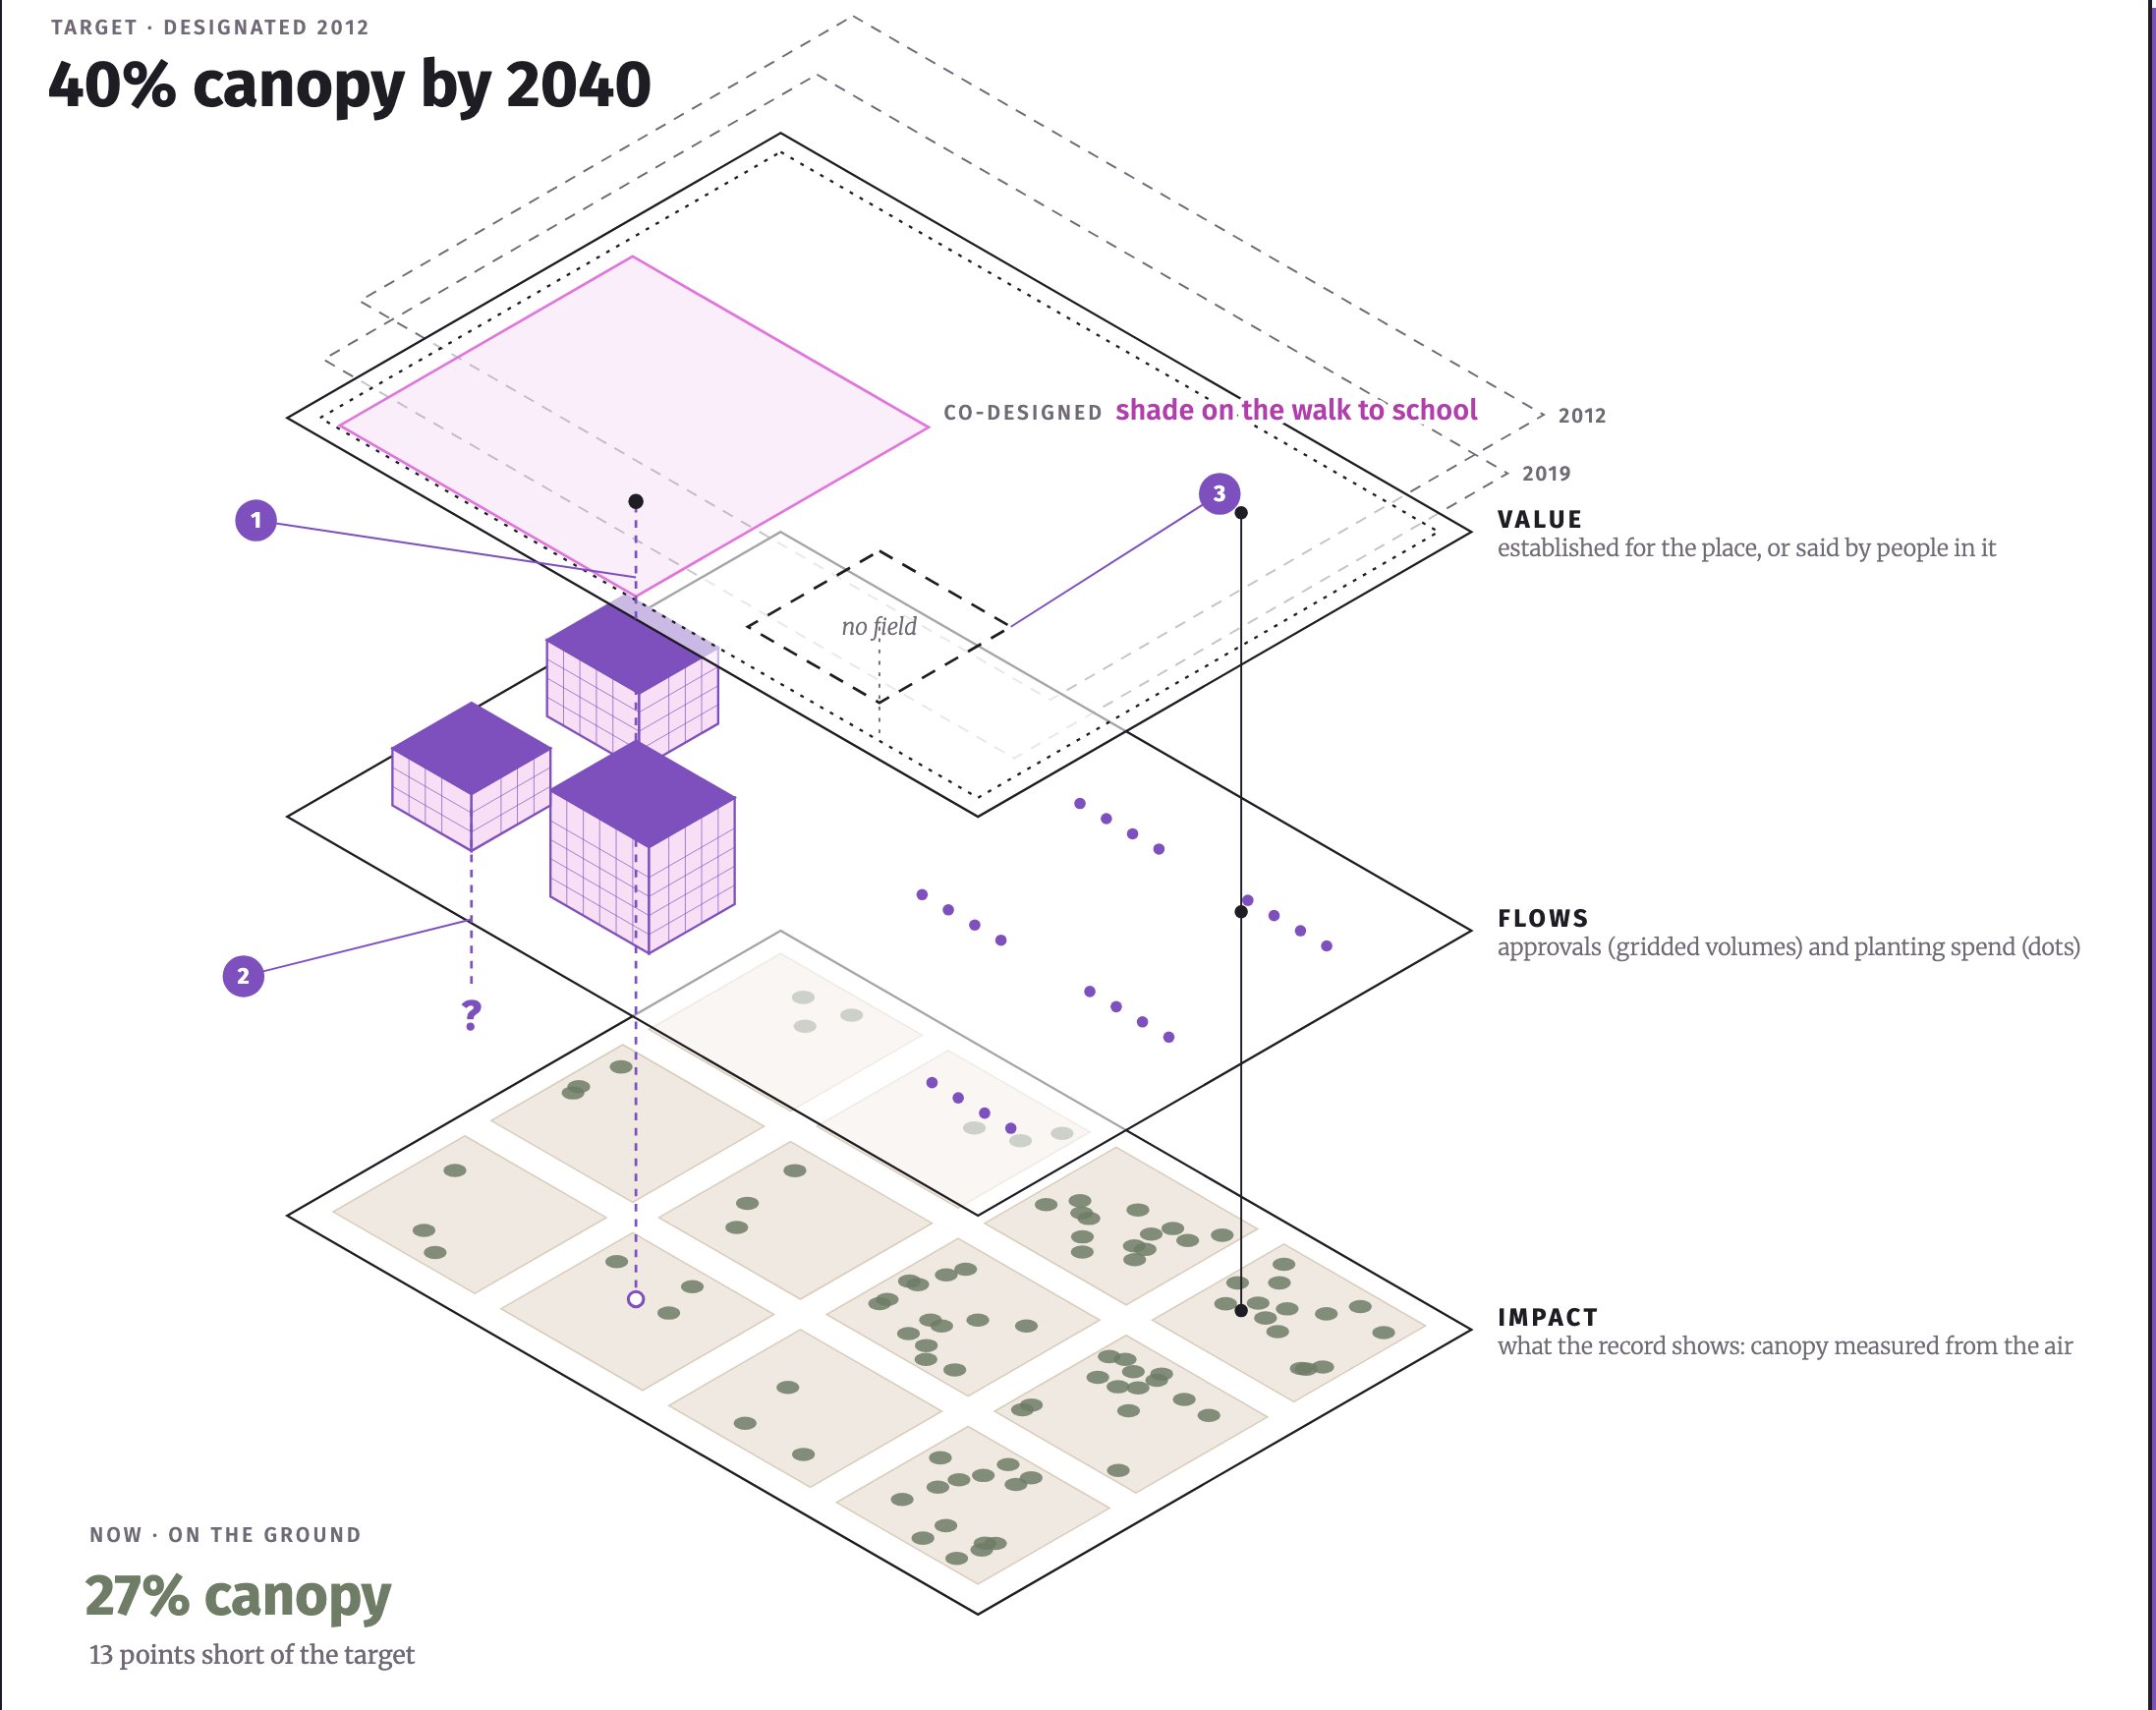
A diagram
A side angle on a place
Whether what was promised lines up with what was funded and what happened.
-
Name your place
Discuss what you found
-
A map, a diagram, or a chart?
Look at the dated table we assembled for your place. Which would show it best: a map, a diagram or a chart? Say what each would make visible, and what each would hide.
-
What values are most evident in the data you assembled?
Across the record for your place, which values come through most clearly? Point to the rows that show them.
-
Which values are hardest to see?
Which values set for your place, or said by people there, have little or nothing in the record to show for them? List each with where you looked.